|
(From Ian G3TVU Quick Start guide, january 2008)
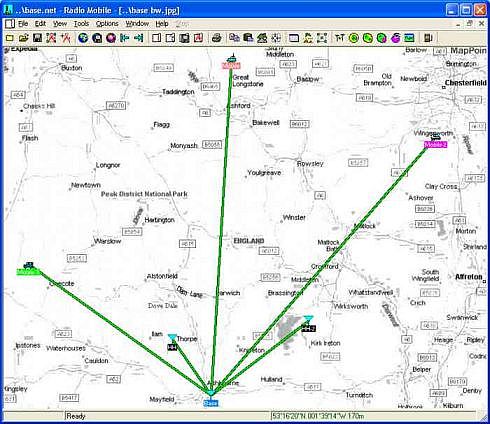
for coverage plots, where the Unit providing the best signal level is displayed from amongst the selected source Units.
As an alternative to the Signal strength displays as in 'Multiple Unit' Coverage, where it is required to find the 'Best Unit' to provide the maximum signal at a location, return to the greyscale road map, and re-open the Cartesian Coverage pane. In this case check the 'Best Unit' box as shown. Selecting a Unit will then allow the Background Color of the Unit Label to be changed - this color will then be used to identify the 'Best Unit' on the resulting plots. Follow this process by clicking on the 'Load Data' button.
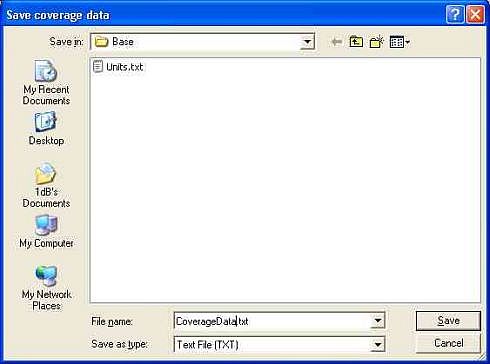
The program will prompt for the location of the previously saved Coverage file (as shown on the Multiple Unit Coverage page) which will then be loaded.
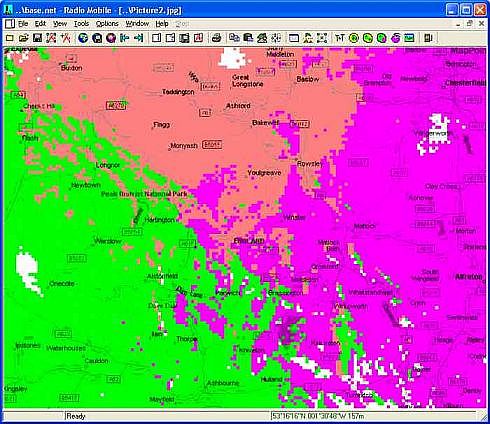
and produces the following window showing the Best Unit for cover at any point on the picture, as indicated by the Unit Background color. Placing the cursor at a location of interest then allows the previous signal strength pictures to be displayed to obtain the actual signal levels at that point.
Note that if the 'Best Unit' box is checked, and the Draw button pressed, the separate signal coverage plots will be performed, and the pictures saved in the Frames directory - but there will be no 'Combined Signal Coverage' plot performed. Loading the coverage data as above but without the 'Best Unit' box checked will produce a combined coverage plot - but with a dB legend displayed. So it is worthwhile performing a 'Rainbow' plot first to obtain this.
The above process can also be carried out on a zoomed area of the map for a 'Detailed Area Coverage' plot.
|
