|
(From Ian G3TVU Quick Start guide, january 2008)
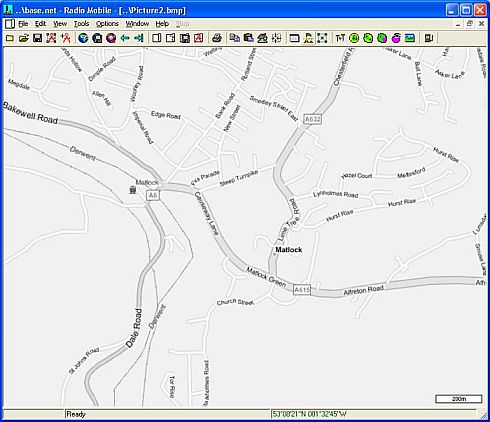
It is possible to perform a Combined Cartesian plot over a zoomed area of the main map. The following picture is a Zoomed area from the Base Network in the town of Matlock. The picture was Merged/copy with a Virtual Earth roadmap then forced to greyscale, and a distance scale added to produce:
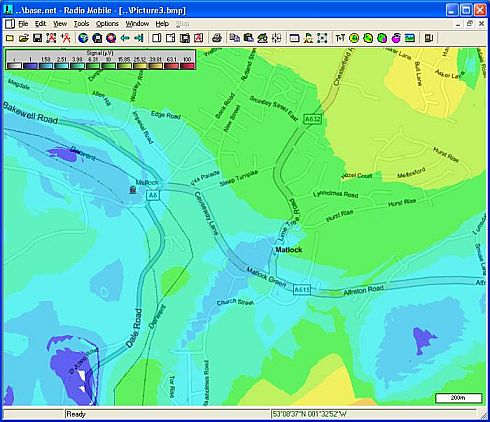
A 'Single Unit' Combined Cartesian plot was then performed on this picture using the Base Unit as centre and a HH Unit as the mobile within the area, (at 1 pixel resolution), to show the predicted signal coverage over this small area:
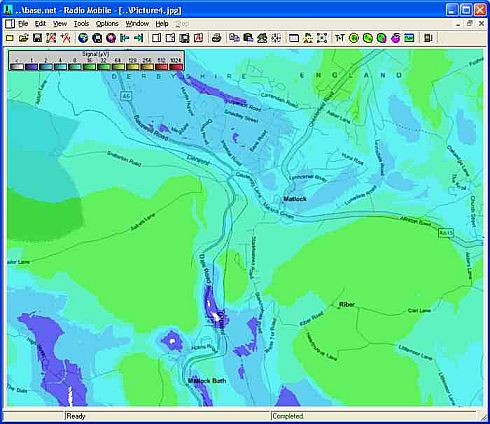
In a similar manner, a 'Multiple Unit' or a 'Best Unit' plot can be performed on this zoomed area. Using the three Mobile Units as in the 'Multiple Unit Coverage' and 'Best Unit for coverage' pages, the following plots were generated.
Best signal strength from all three Mobile Units:
Best Unit displayed by the Mobile Unit Background color:
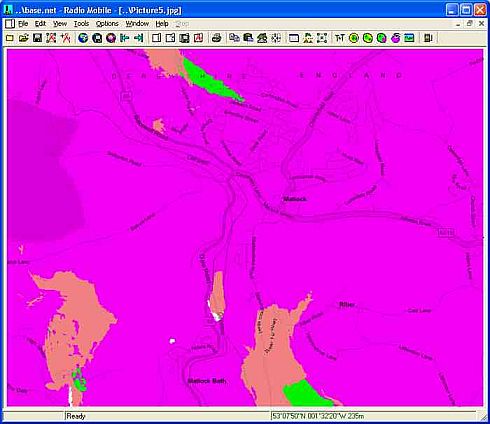
If the above two pictures are opened in RM, a click on a point on the Best Unit picture will generate the cross wire cursor - moving to the Signal Strength picture will then show the actual best signal level at the cursor position from the picture legend. If it is desired to find the actual signal strength from each Mobile Unit, the Coverage pictures have to be opened from the Frames directory as in the Multiple Unit Coverage page.
|
