|
(From Ian G3TVU Quick Start guide, january 2008)
where the performance of a single Unit coverage to a defined mobile Unit is performed in a radial sweep manner. Azimuth covered ,and radial range of the plot can be specified.
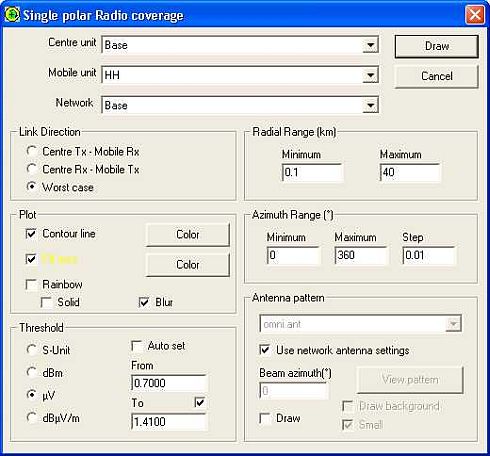
A click on the toolbar icon, or by opening 'Tools > Radio Coverage > Single Polar' will show this pane.

A 'Single Polar' plot is performed in an azimuth manner, centred on the selected 'Centre Unit' over a defined radial range and transmission direction. The plot resolution is generated in the selected 'degree step' wedges, over an azimuth range and in radial increments, i.e. this means that the perimeter of the plot has lower resolution than areas nearer to the centre.
The centre unit and the unit whose parameters are to be used as the receiver have to be selected. You also have to decide on the Units of measurement and range of signal levels to be displayed, (or use 'Auto set' to reference to the receiver threshold and maximum signal available), along with the Azimuth and Radial Range to be plotted. It should be noted that the display generated for a Fixed Unit 'Gain' antenna is as if that antenna was pointed towards a particular azimuth - it can be the link direction or defined, i.e. its radiation pattern and direction does apply to the plot. The antenna pattern can be shown on the plot by checking 'Draw' which creates a small drawing of the antenna pattern overlaid at its location aligned with its azimuth, with the capability of selection of a smaller version with or without a background. The Mobile Unit however is treated as if it has an 'Omni' antenna, even if in fact a gain antenna is specified in its System. The effect of this is to make a gain antenna at the Mobile Unit always point towards the Fixed Unit for every location.
On the pane above, the Link direction is selected as 'Centre Tx - mobile Rx', whilst the reverse direction performance of the 'mobile Tx to Fixed Rx' can also be plotted.
The 'Worst Case' plot displays the worst signal level for the two-way link. It is of particular interest when investigating the performance of a Radio Repeater to a low power mobile unit, and plotting the available communication area for this system.
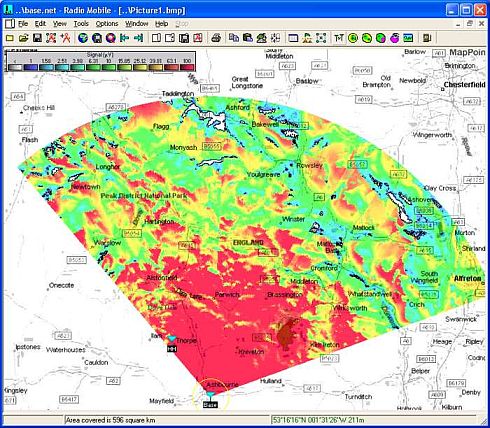
The 'Contour line', if selected, is drawn at the lower boundary of a plot, and with 'Rainbow' the fill is multicolored. Where Rainbow isn't selected, the plot can be in a single color showing the signal range set in 'Threshold'. The plot below has a Rainbow range of 1uV to 100uV selected. By using the 'Auto' check box, the program uses the receiver threshold as its lower signal level, and calculates the highest level from the signals available.
During plots, the computer CPU load can be reduced by pressing the S key to slow down processing, or paused using the Space Bar - these actions are reported on the lower data area of the pane.
It is best to produce plots over greyscale or Black/White picture to avoid color confusion. If a colored map is used, you will be prompted to convert to grey scale before plotting. The sort of plot produced is shown below (at reduced resolution), for Base to Hand Held units for the Fixed Unit 'Omni' antenna defined above over a black/white road map.
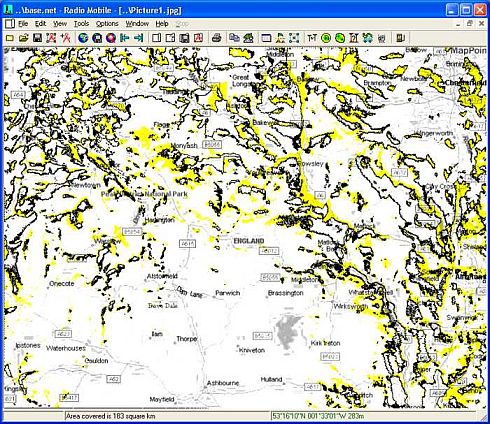
Worst Case coverage plot:
Making a 'Worst Case' plot for the Base to HH Unit, which shows areas in the +/-3dB range displayed on Radio Links, the following settings can be used:
Which produces a single color plot (kept in new picture) of coverage areas in yellow (with a black lower boundary) which has worst signals in the range of +/-3dB relative to 1uV.
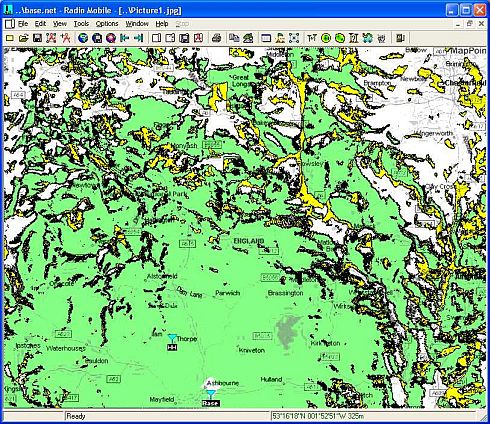
Whilst modifying the plot to show >+3dB as Green with these settings
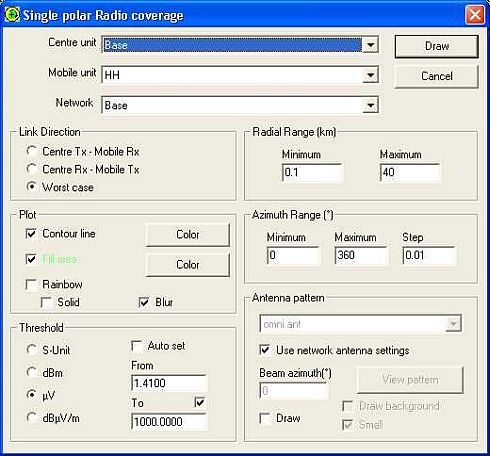
and kept in picture produced showing areas where two-way communications are possible in Green, and probable in Yellow.
|
