|
(From Ian G3TVU Quick Start guide, january 2008)
An Interference plot over an area is produced between a wanted and interfering station, where the minimum signal level and interference margin can be selected and plotted as required.
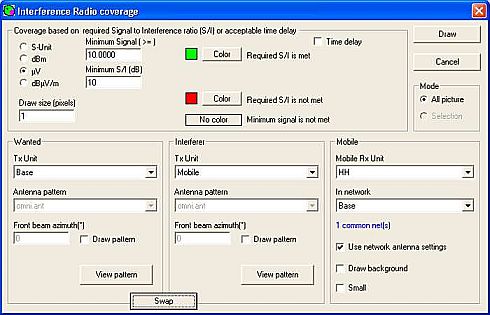
A click on the toolbar Icon Or by opening 'Tools > Radio Coverage > Interference', the following pane will open, where the wanted and interfering units are selected, and the interference margin defined for acceptable communications. The Mobile Unit has been moved to the top of the map for these plots, and is used as the unwanted 'Interferer' with communications between the Base and Hand Held Units.

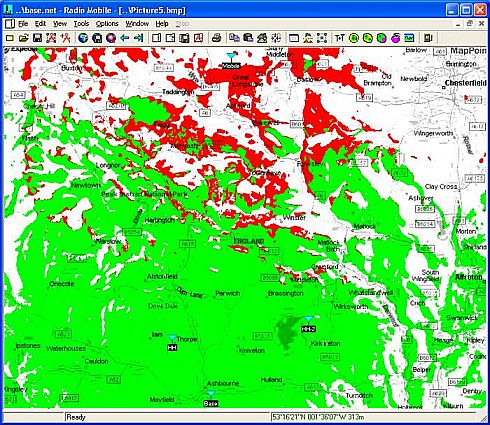
Where pressing 'Draw' produces this plot:

The Red areas showing that the Mobile Unit exceeded the margin in these locations with the Hand Held Unit, and green areas where the margin was acceptable, with Base to HH Unit communications available.
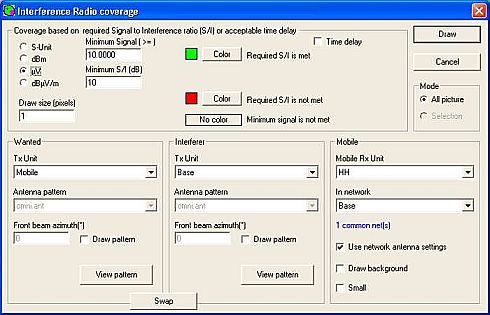
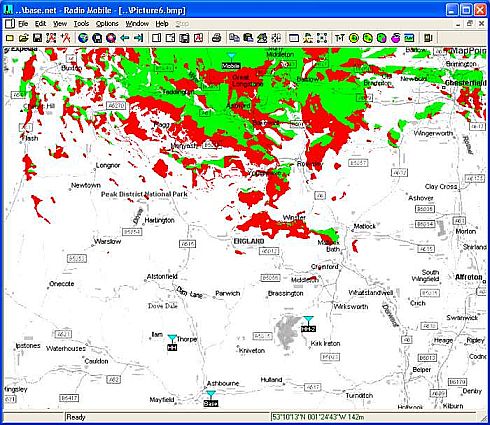
Invoking the 'Swap' button, reverses the roles of wanted and interfering Units, and will show the areas where acceptable communications between the Mobile and HH Units can be achieved.

Clicking on 'Draw' then produces:

It should be noted that the swept 'Mobile receive Unit' selected above, is always treated as if it has an 'Omni antenna', regardless of its Network Antenna setting! The two transmitting Units can have gain antennas specified, and the characteristics applied to the plots.
Where it is required to accurately determine the Signal to Interference level in a Network having gain antennas, the Radio Link pane should be used.
|