|
The accuracy of a model predicting RF propagation can be expressed in the following KPI (Key Performance Indicator):
- Average error of predicted to the measured fieldstrength
- Standard deviation
- Correlation of the predicted to the measured fieldstregth
The optical verification, where the prediction results are compared to the survey data in a map window, will not produce answers with the accuracy or in numbers as mentioned at the KPI. The optical verification method is a rough, quick and dirty, way to determine if the result for the analysis makes sense. If you have experience in processing large tables in excel and know something about coordinate systems, dB's and fieldstrength calulation it is suggested to follow the mathematical appoach.
Reference file
For the purpose of reference a example survey file is available from this site: 'SurveyAnalysis_LandCover.xls' the contens is discribed in this chapter.
The file holds the following sheets:
- Survey Analysis - holding the data and the calculations
- Error (dB) - Graph
- Error vs Distance - Graph
- Error (dB) Clutter - Graph.
Verification example.
Before you can do a verification survey data has to be processed and ready for useage. Collecting data is described in 'Test site' and 'Survey vehicle'. Post processing survey data is described in 'Survey data'.
The survey data is split in to two data sets. It is important to have both data sets 100% equal with respect to the point they refer to. This is escribed in 'survey data' where the survey data is post processed.
The following steps must be taken:
- collect survey data
- post process survey data in to 2 equal data sets: The survey route in '.plt' object format and the reference that holds the measured values in Excel.
- set the required settings with respect to the model in 'network settings > Parameters'
- Set the required settings in 'Land Cover'
- analyse the survey route file using 'Radio Route coverage'
- Save the result of the 'Radio Route Coverage' analysis using 'edit > save data'
- Import the result file of 'Radio route coverage' in to excel.
Now we can compare both survey data file with the results of the prediction performed by Radio Mobile. The following image displays the procedure.
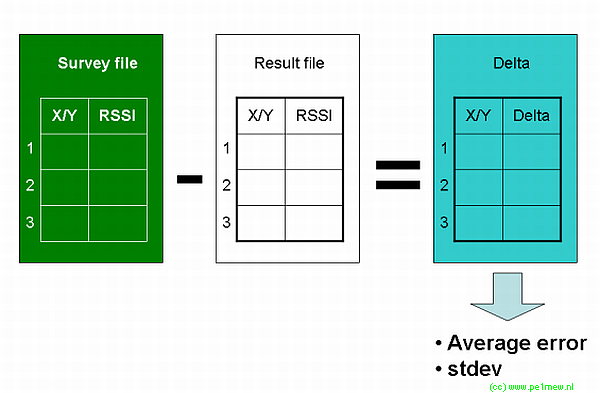
The Survey and the result file are copied in to the Excel sheet 'Survey analysis' and then compared on a per waypoint basis in coloumn 'L' in the last cell of this coloumn the average is calculated and the standard deviation of the errors.
Now we have the error calculated we can display the result in a graph: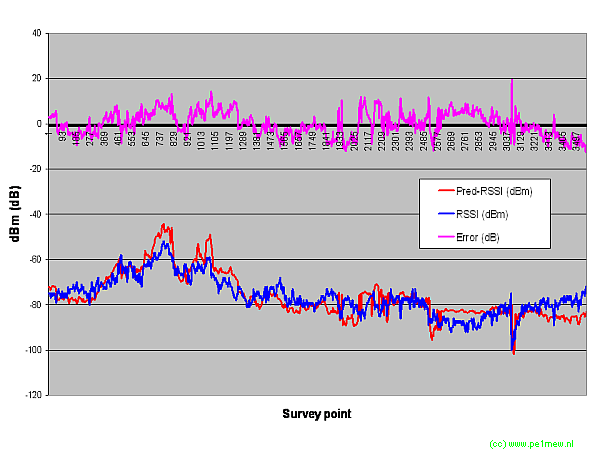
The graph displays the measured RSSI (blue), the calculated or predicted RSSI (red) and the error or difference between the real and the predicted RSSI (purple). The Graph shows a situation at the end of a process of modeltuning. The everage error is 0,08 dB at a stdev of 5,2 dB.
The result file also produces the distance between the surveypoint and the test site. see coloumn 'E'. Using this we can produce a graph that displays the prdeiction error vs the distance:
As you can see the current settings in the model result is the most accurate prediction at about 6 Km from the site.
Conclusion.
Using a numerical method we can determine more accurately the accuracy of the prediction model.
The numerical approach is also used for 'Land Cover verification'
|
